 Thingiverse
Binghamton Election District Maps
by anoved
9
Downloads
12
Likes
0
Makes
This pair of prism maps offers a comparison of population density and voter turnout by election district for the city of Binghamton, NY.
The top and bottom of the reference walls represent the upper and lower bounds of the data as specified in the `.scad` scripts. The population density scale ranges from `0` to `5000` people per square kilometer; the voter turnout ratio scale ranges from `0` to `1` (100%).
---
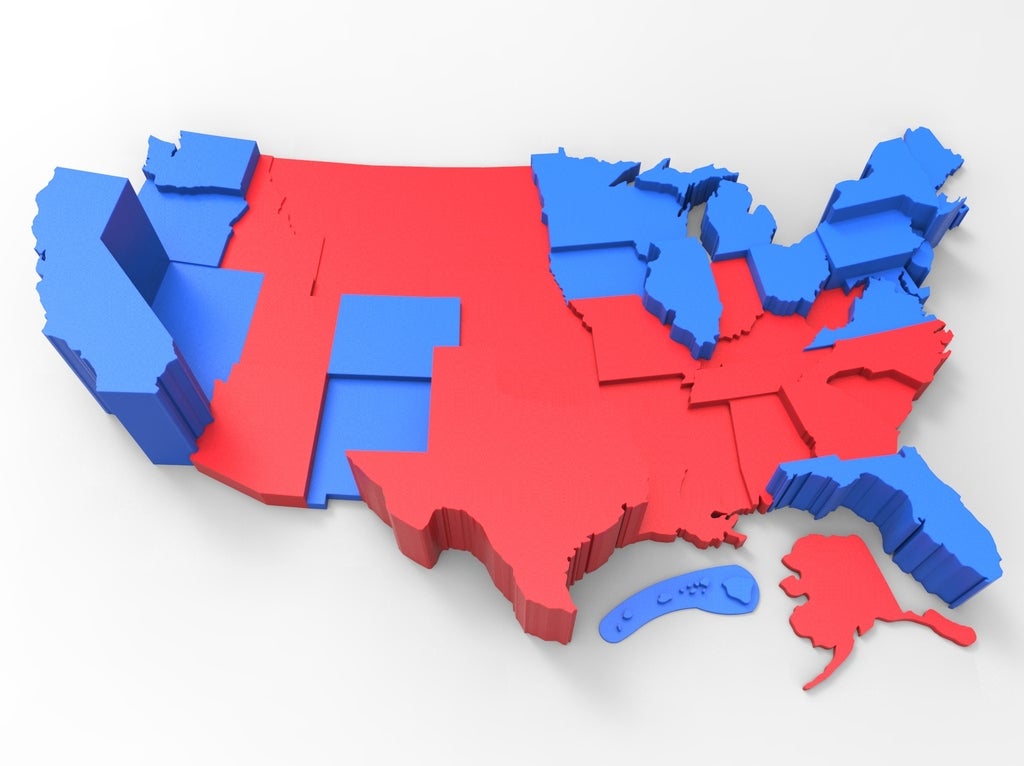
*For a customizable prism map with broader appeal, see my [Contiguous United
The top and bottom of the reference walls represent the upper and lower bounds of the data as specified in the `.scad` scripts. The population density scale ranges from `0` to `5000` people per square kilometer; the voter turnout ratio scale ranges from `0` to `1` (100%).
---
*For a customizable prism map with broader appeal, see my [Contiguous United


Sign in to leave a comment
Sign in